According to Harvard University’s Joint Center for Housing Studies, the Miami metro area has the highest percentage of renter households spending over half of their income on housing costs in the nation. Access to housing that is affordable for a wide range of residents is crucial for attracting and retaining a talented workforce and promoting regional economic growth. Simultaneously, Miami is in the grips of ever-increasing sea level rise and related flooding impacts, with the Southeast Florida Regional Climate Change Compact projecting an additional six inches of sea level rise by the end of 2030.
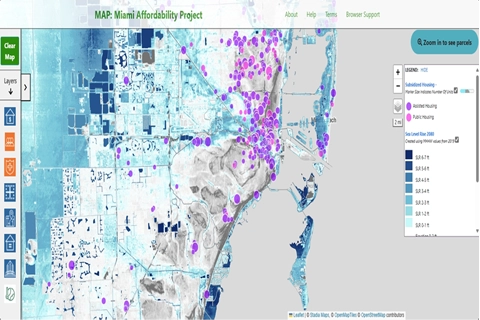
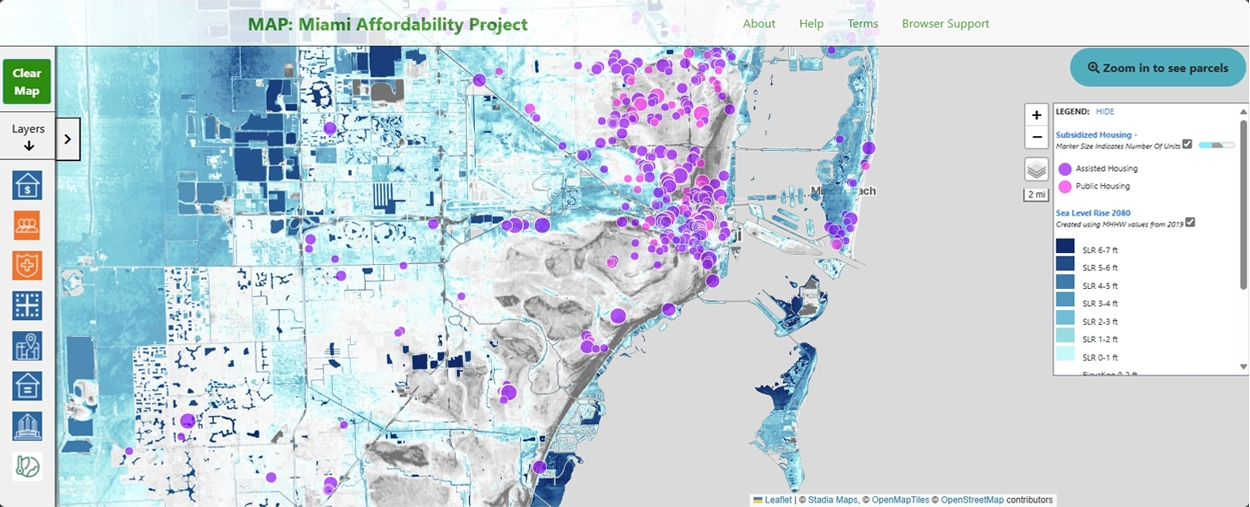
Developed by the University of Miami's Office of Civic and Community Engagement, the Miami Affordability Project (MAP) is an interactive online map centered on the distribution of affordable housing and housing needs in the greater Miami area. MAP also features data on sea level rise and flood zone, allowing users to understand the impacts of flooding on Miami’s affordable housing stock. MAP enables users to visualize information about two of Miami’s most pressing challenges, affordable housing and climate change, together in an interactive map that can engage a wider audience of participants in discussions about livability, equity, and responsible growth.
The MAP serves as a tool for planners, policymakers, affordable housing developers, community organizations, and urban and environmental researchers to explore Miami's housing landscape, address needs, and promote informed decisions about housing policy and urban resilience. The tool uses data generously made available by the Shimberg Center for Housing Studies at the University of Florida, Miami-Dade County Department of Housing and Community Development, Miami-Dade County Department of Envthe City of Miami Department of Community and Economic Development, the Southeast Regional Climate Change Compact, and the National Oceanic and Atmospheric Association (NOAA).